After starting a podcast, it can be intimidating to know whether your efforts to grow your listenership are working.
Pinecast analytics provide you with the tools you need to understand what's happening after you post your episodes.
Listens
"Listens" as they appear in your dashboard correspond to downloads of episodes. We count the number of downloads that your episodes receive, and deduplicate them to avoid the same listener appearing twice for the same episode in a short span of time. Some services like Spotify deliver data to us regularly, which we display for you.
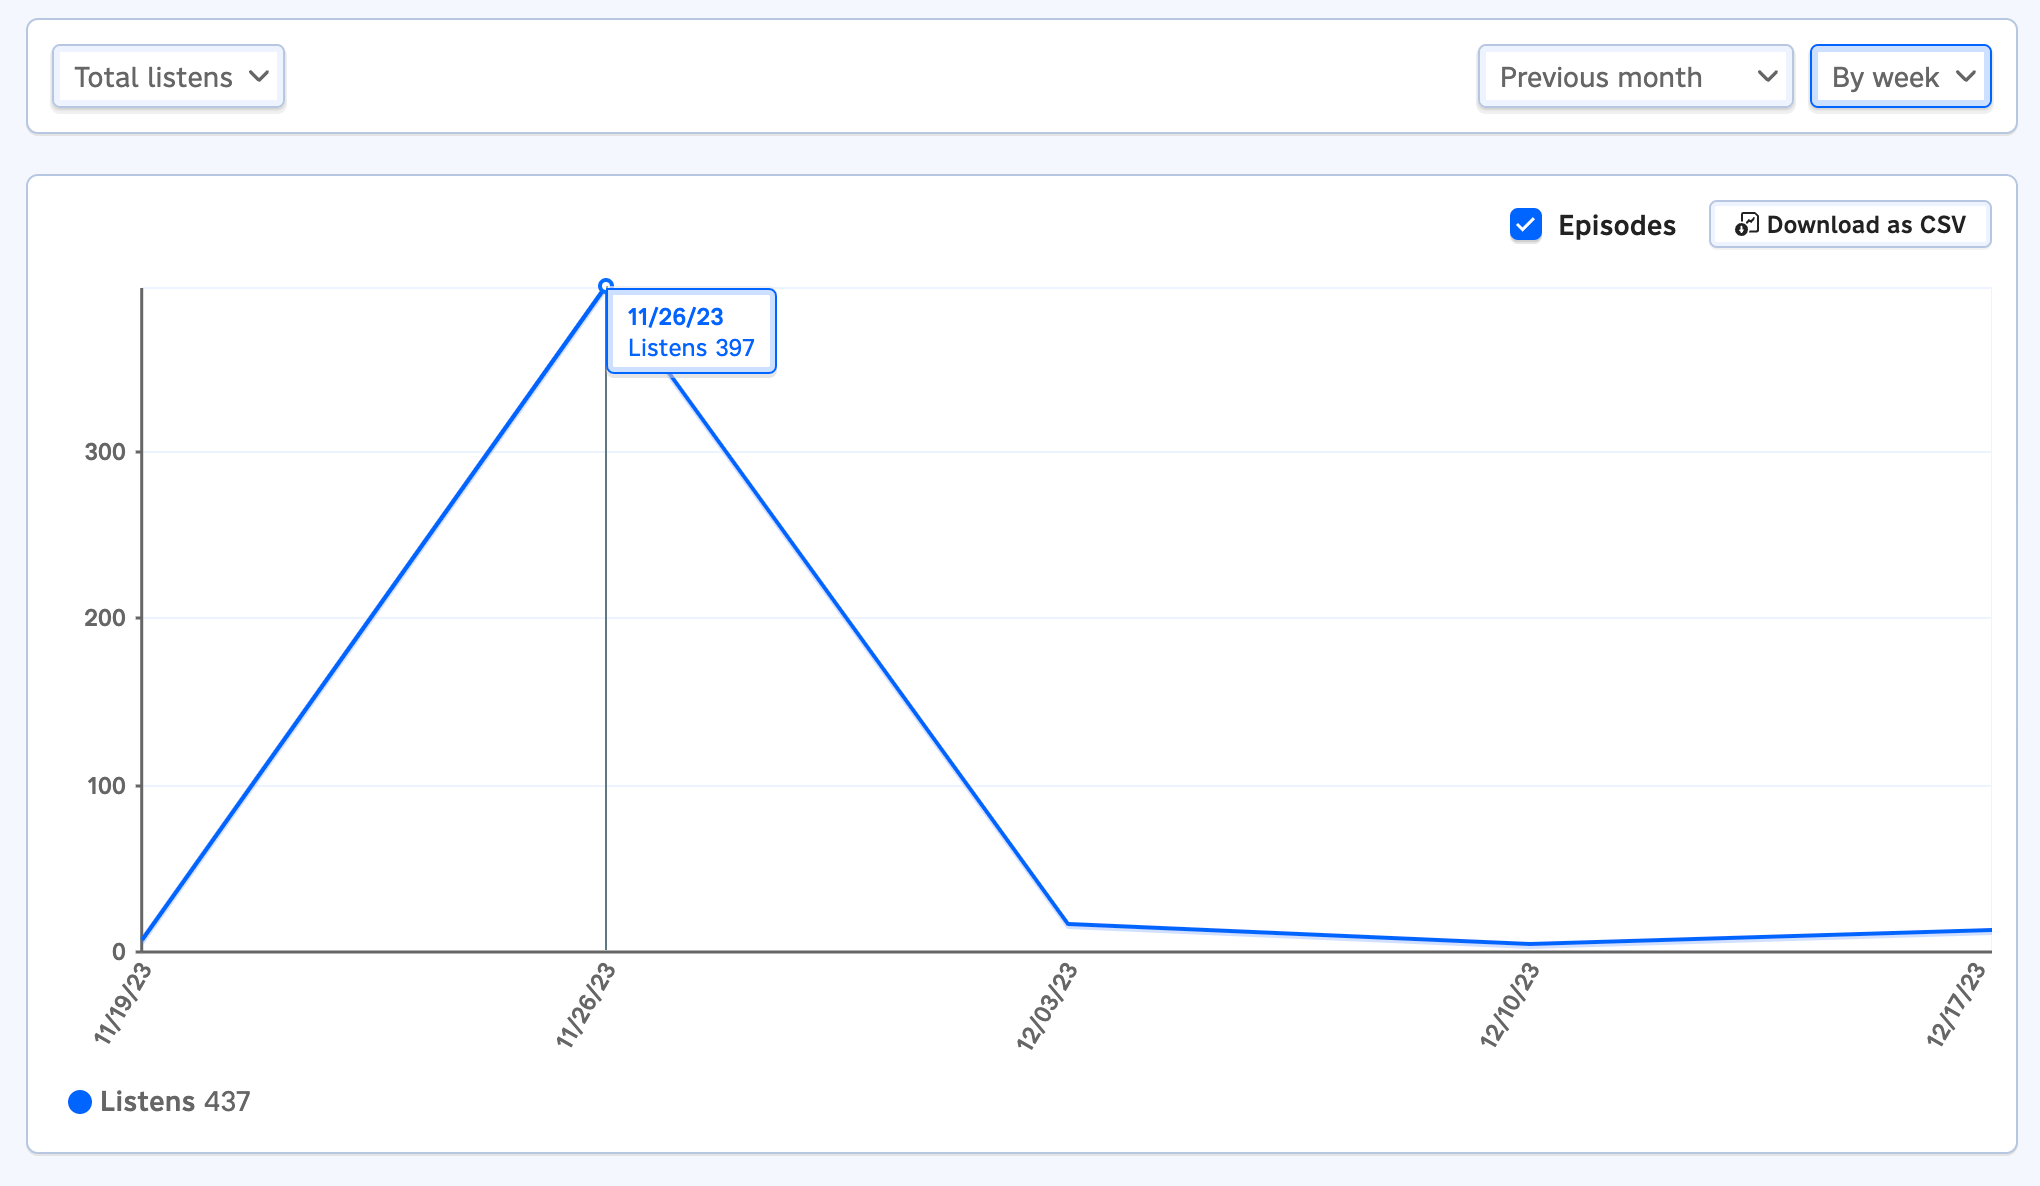
Use the granularity selector in the upper right to change from "By day" to "By week" or "By month" (or for short time spans, "By hour"). Larger time units help you to understand trends, which are harder to suss out with smaller time units. Shorter time units are more useful for understanding short-term listen patterns, like listenership after an individual episode was released.
Breaking listenership down
There are many ways to visualize your listens. The different views can be accessed with the dropdown in the upper left of the analytics charts.
With "Listens by episode (truncated)," for instance, you'll see an area chart of listens broken out by episode. Episodes with only a small handful of listens roll up to an "Other" series for clarity.
"Listens by source" shows what channels your podcast has gotten listens from (RSS, Spotify, direct listens, our embeddable player, or short links). "Listens by agent" and "Listens by agent over time" show the breakdown of which apps your listeners tuned in from. "Listens by time of day" shows the hours of the day and the days of the week that your listens arrive during.
All of the analytics views are documented on our support website.
Pro Analytics
We offer an add-on upgrade that gives you access to even more data: Pro Analytics. With the Pro Analytics add-on, you can see listen growth, listener locations, and the top-performing episodes over a given time period. The add-on is prorated and costs an extra $10/mo (or $110/yr).
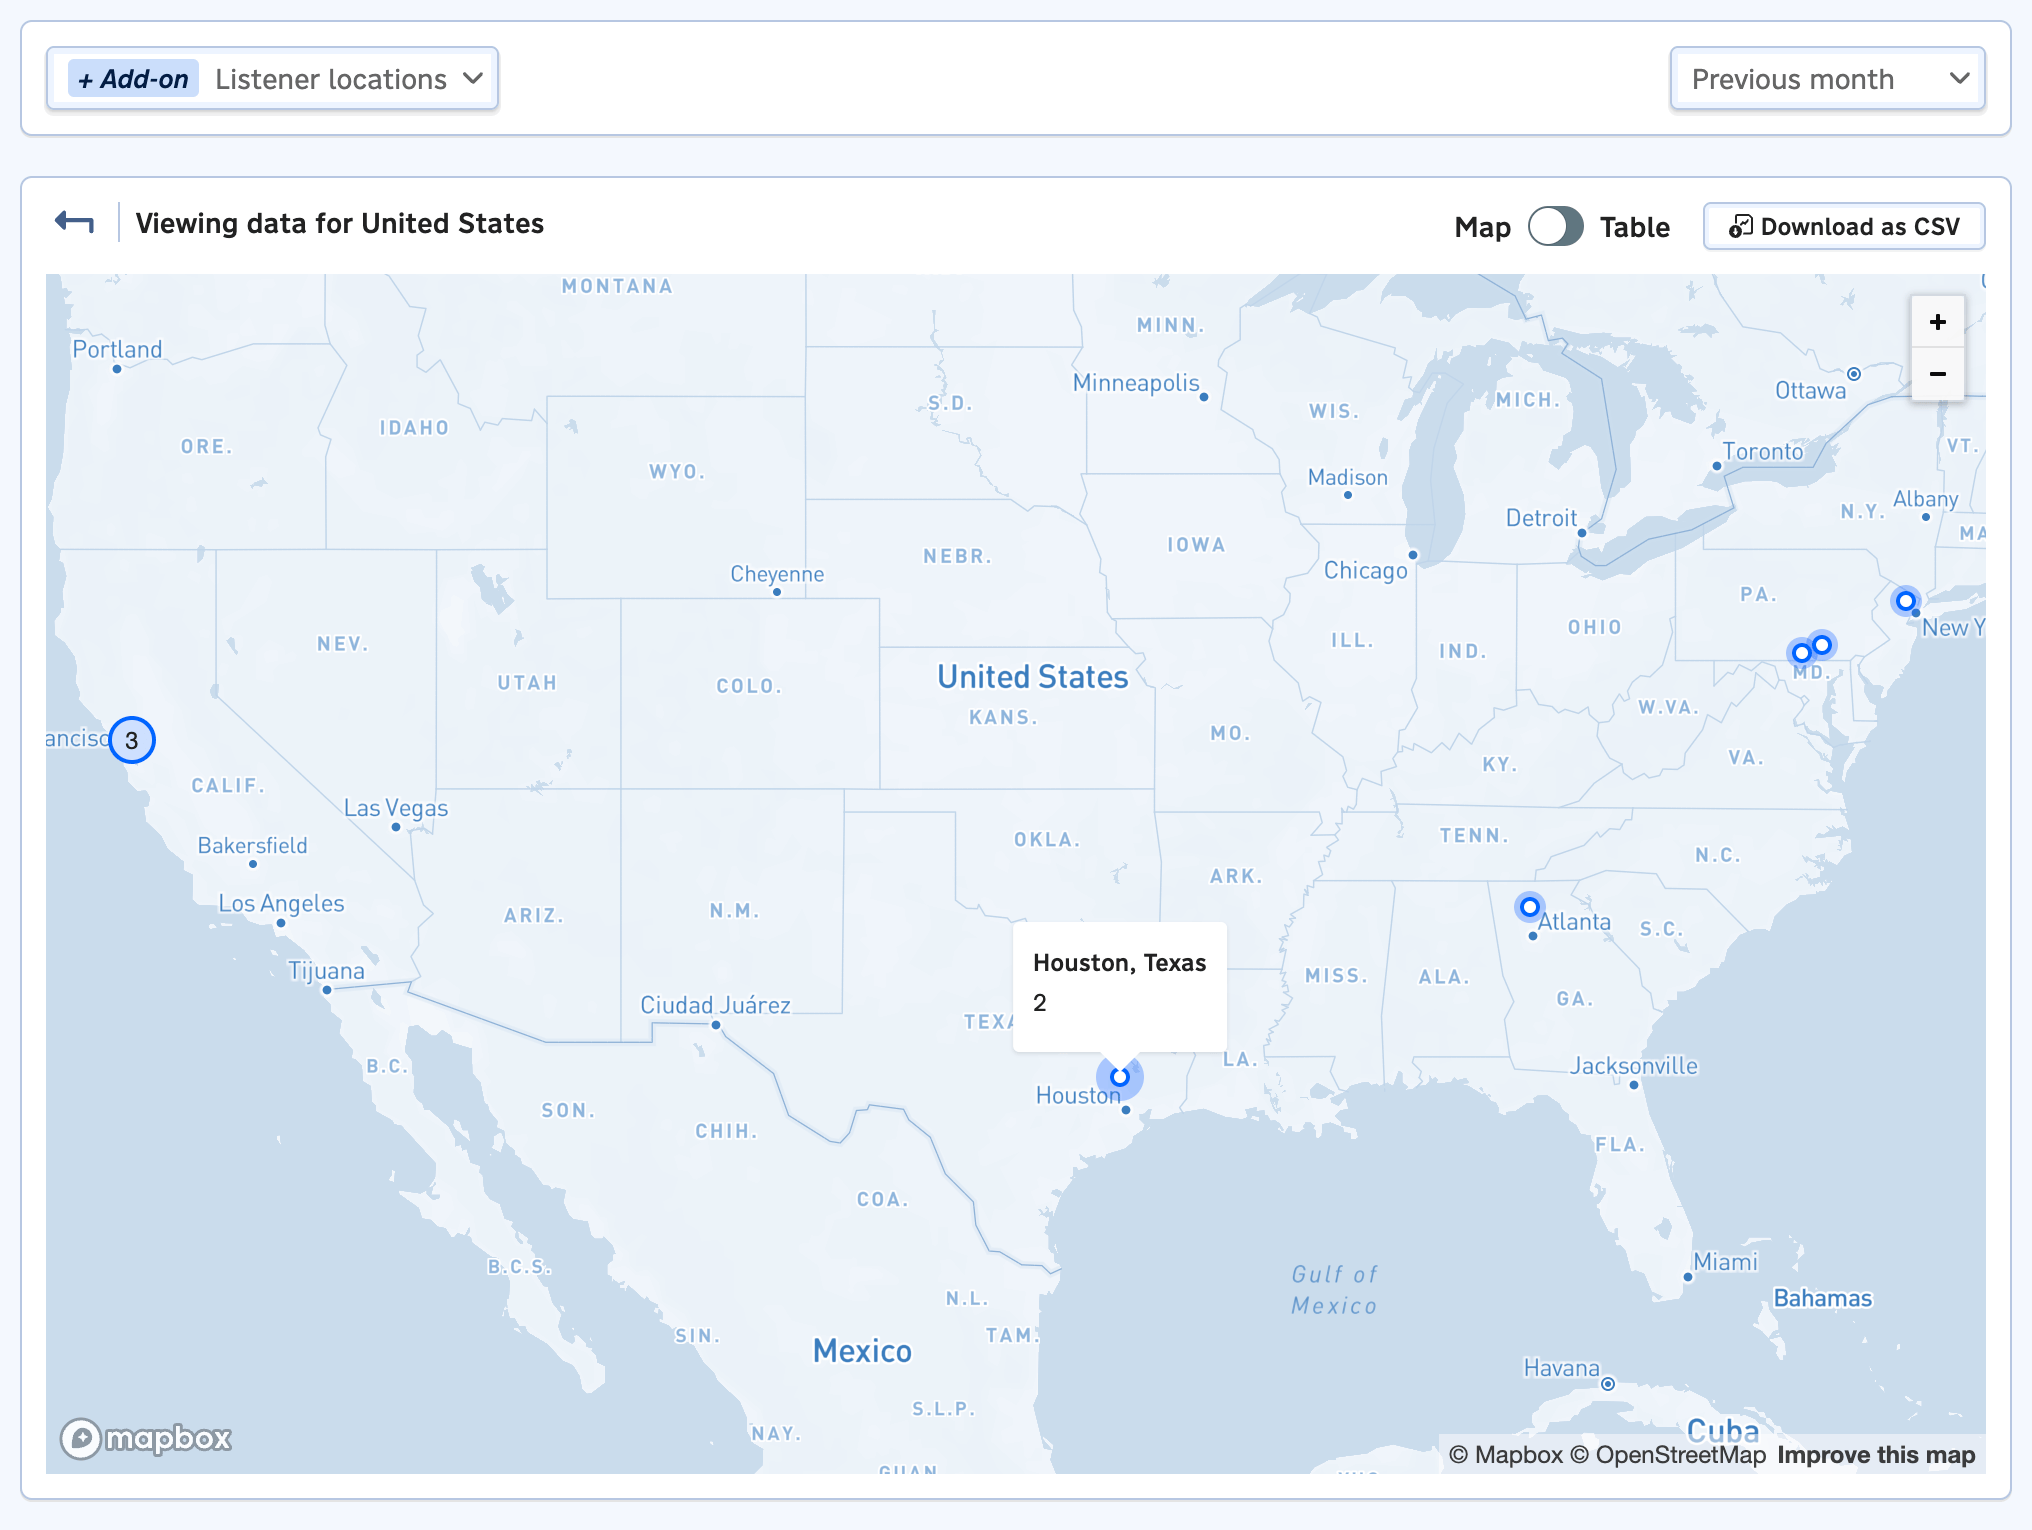
The view above shows listens broken down by city. A country-level view is also available.
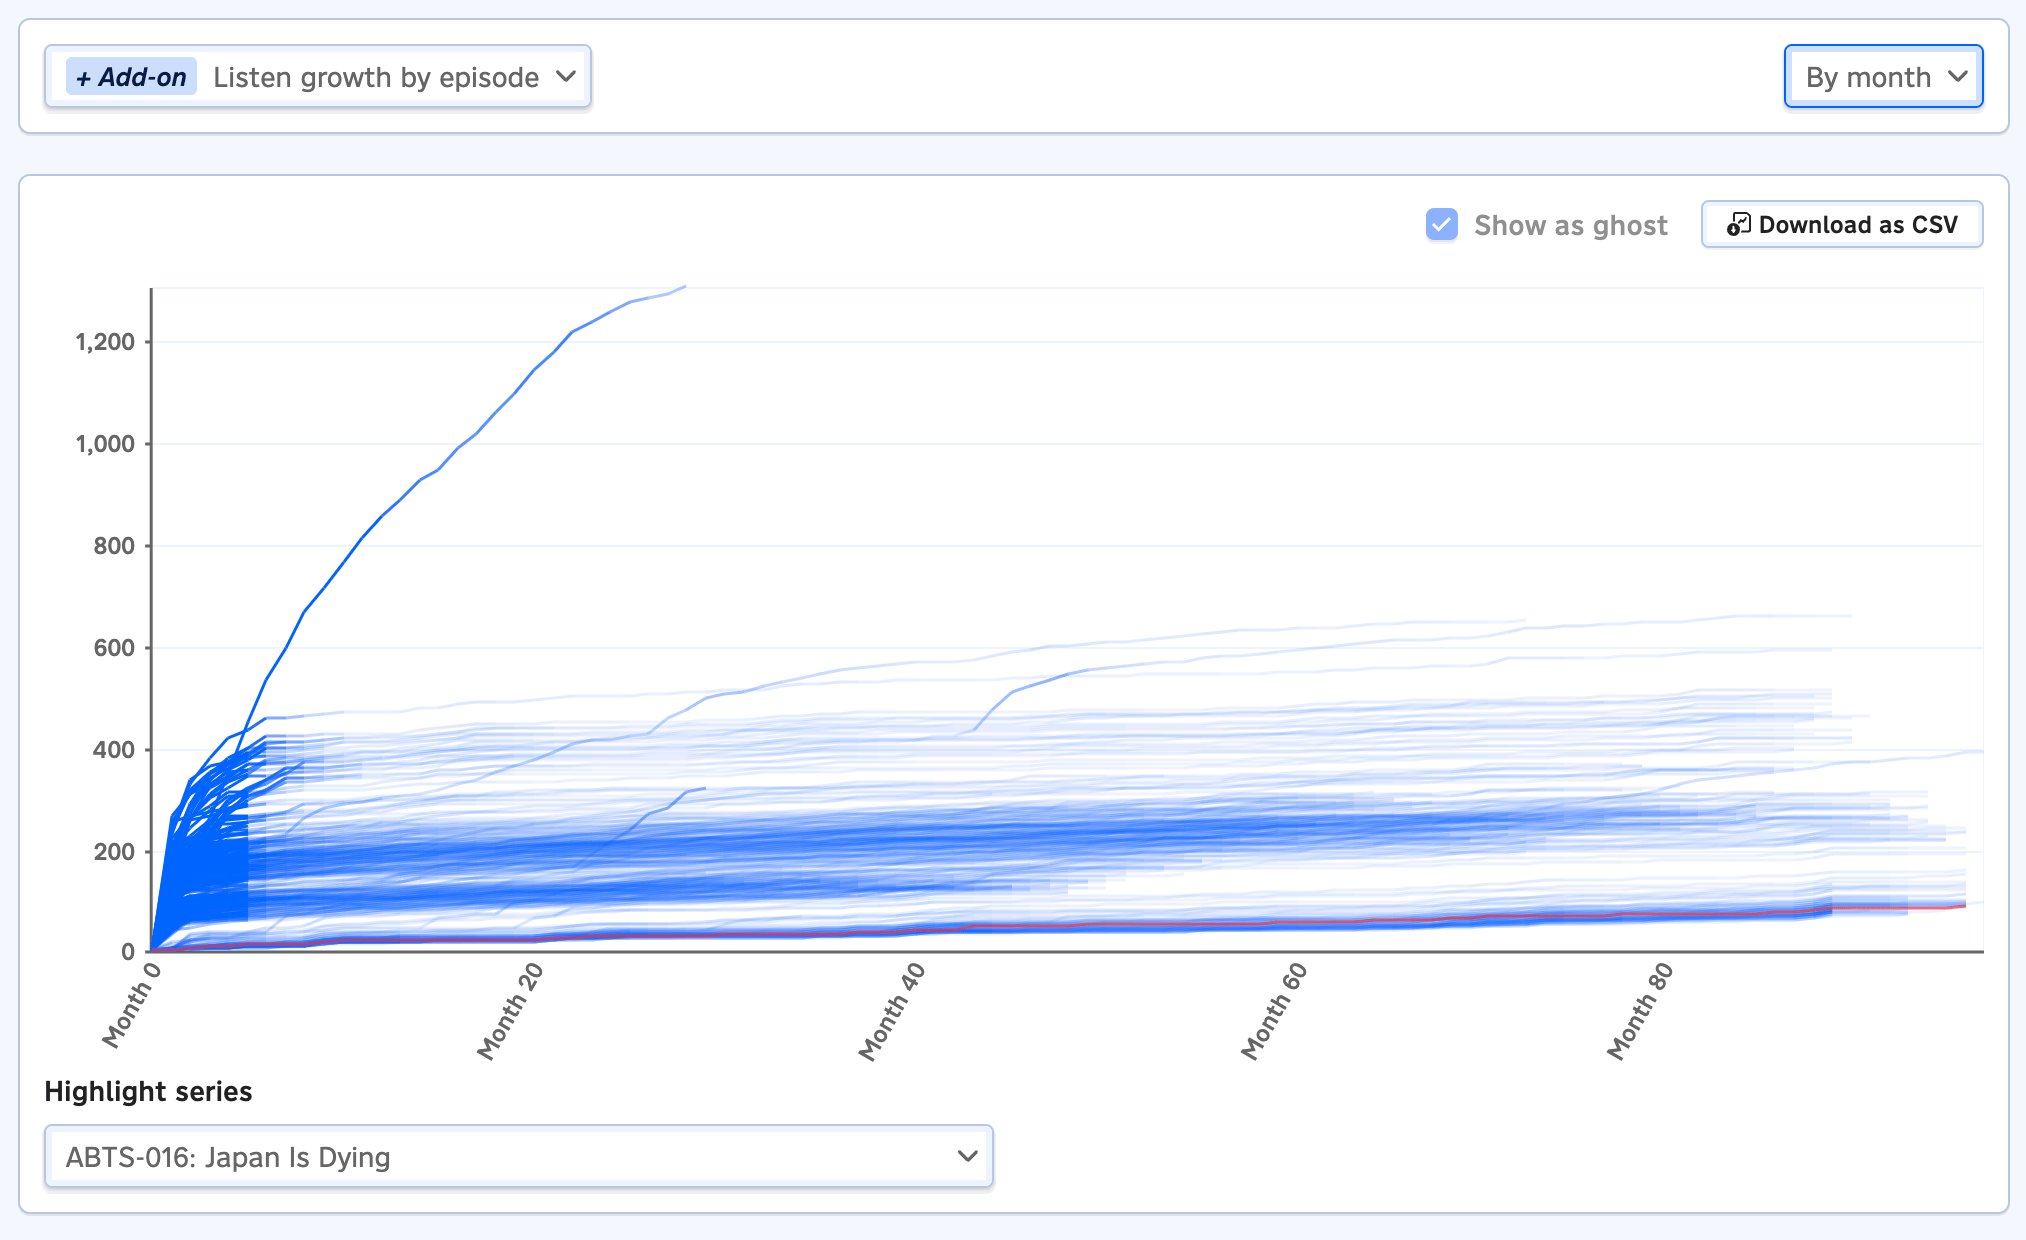
Another powerful view lets you compare how quickly different episodes received listens. The far left is the moment that each episode is published, and the height of each episode's series in the chart represents its cumulative listens at that point in time. This view lets you identify content that's gaining popularity fast, not just which episodes have received the most listens.
Charting tips
- Use the "Download as CSV" feature to download a spreadsheet of any analytics view. You can open it with Microsoft Excel or Google Sheets and create your own custom charts with the data.
- Except where otherwise noted, chart data is displayed in your time zone.
- Helpful tips for interpreting each chart are available directly below the chart. You can find full documentation for our analytics features on our support website.
Tracking social
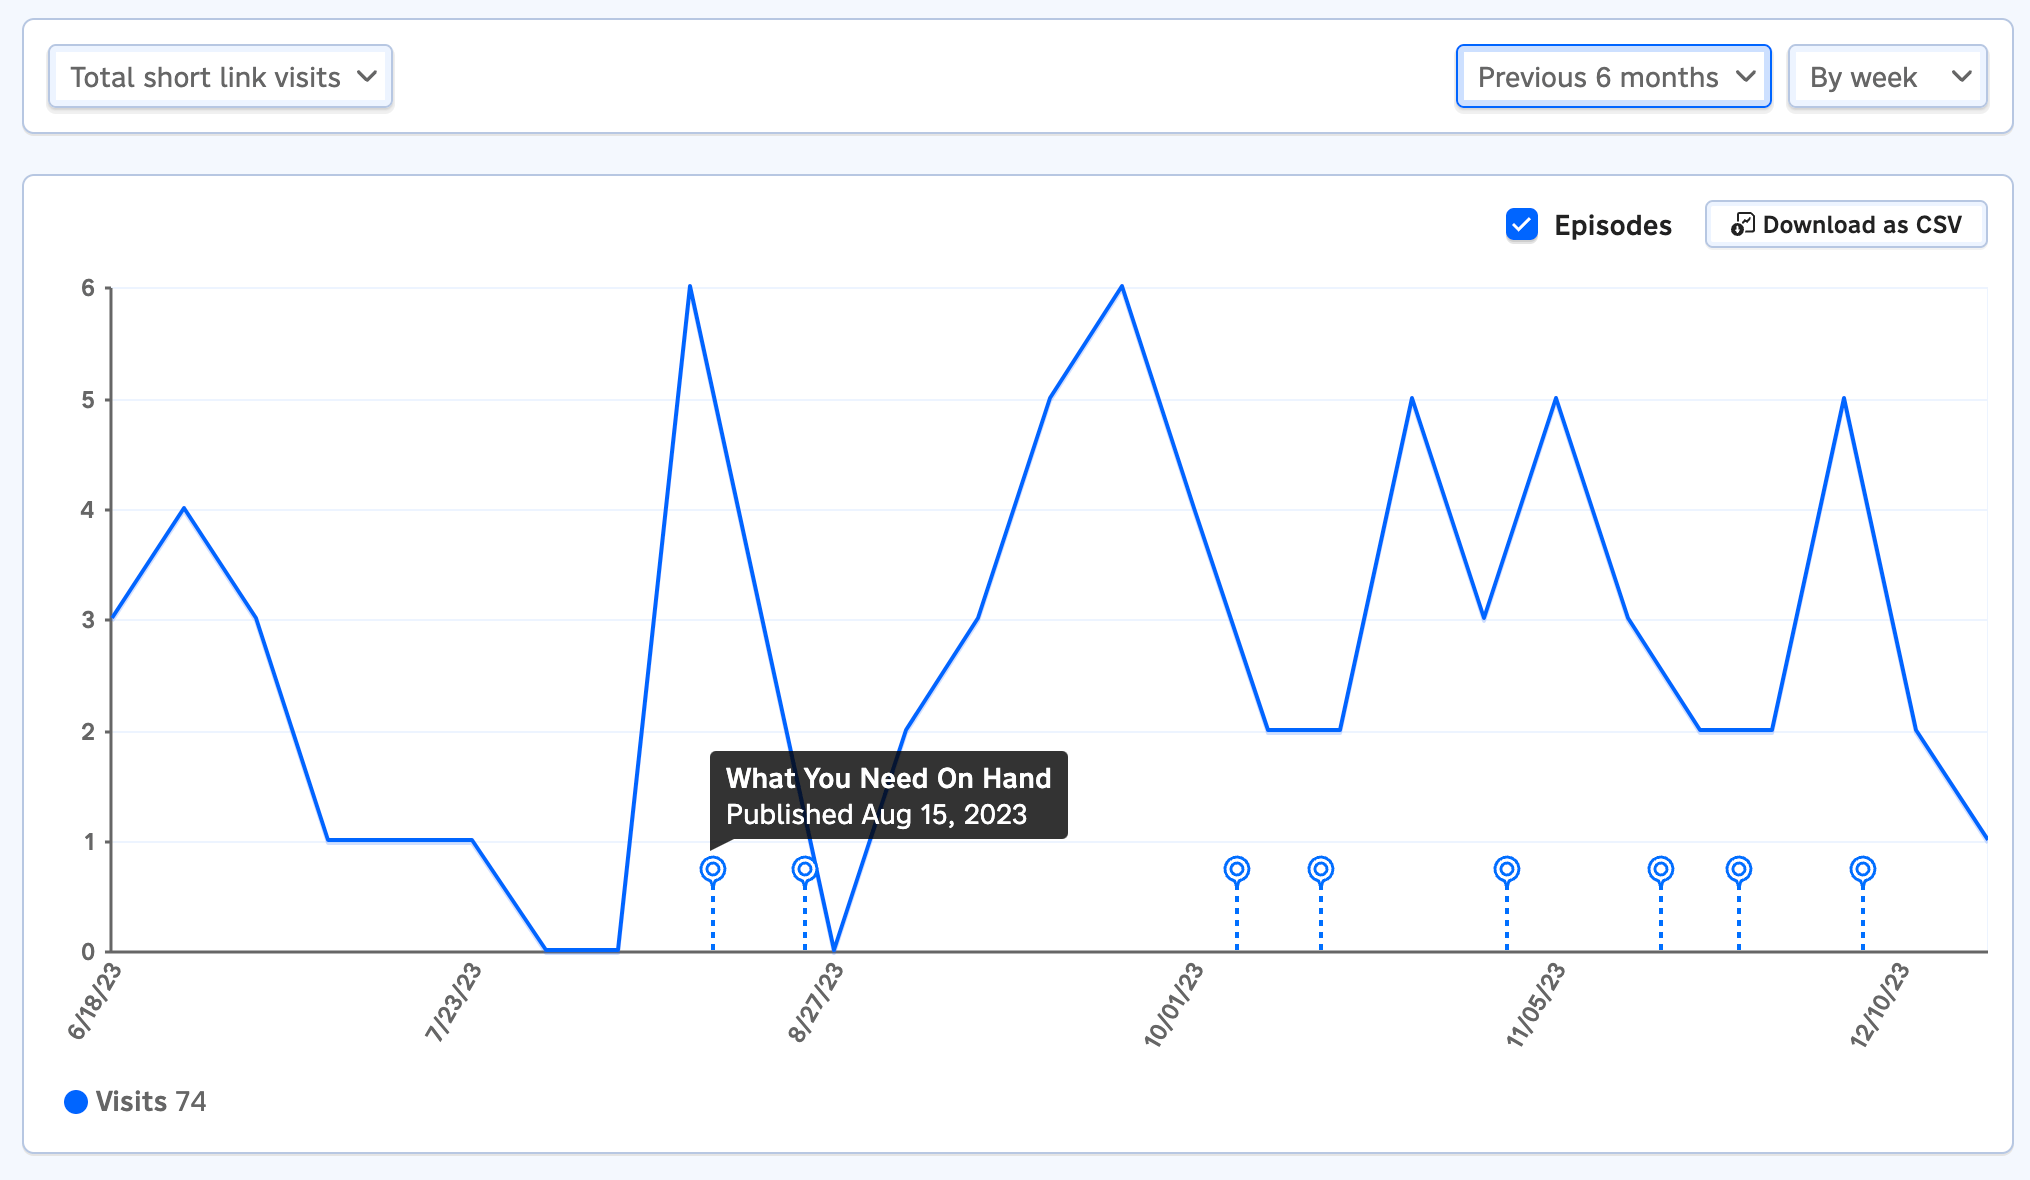
If you use our short links feature, you get baked-in analytics for free. "Total short link visits" will tell you how many folks visited your short links. If you share the short link for an episode on Twitter, for example, you can see how many folks clicked on the link. "Short link visits by browser" breaks down the browsers folks used: this can help you identify the sources of traffic to your short link. "Short link visitor locations" (available with Pro Analytics) shows you where those visitors are from. And last but not least, "Short link clickthrough breakdown" shows which apps folks clicked on when they visited your short link.
Because you have separate episode and podcast short links, the podcast short link analytics are unconnected to your episodes' short link analytics (unlike listens, where the podcast's listens aggregate each episode's listens). Prefer to share your episode's short links to help make it easier to attribute listens to links.
Keeping up with your listeners
It's important to hear from your listeners. Engaging your audience makes it more likely that they'll remain a subscriber and recommend your show to friends and family. Pinecast has two powerful options available with our Growth add-on that make it easy to reach your audience.
Review monitoring
Pinecast will monitor your linked listings for reviews. Visit the "Podcast reviews" tab on your podcast dashboard to see reviews on Apple Podcasts and Podchaser. We'll find reviews automatically and send you an email.
Besides searching for reviews across services, our review engine will also look for reviews across regions: on Apple Podcasts, each country has a separate set of reviews. We save you the few dozen clicks!
Feedback
You can receive messages directly from listeners on Pinecast. Visit the "Listener feedback" tab on your podcast dashboard to manage a dedicated comment box for your show. This is available at the podcast level and for each of your episodes. You'll receive an email when a new comment is left.
When publishing an episode, you'll have the option to set a feedback prompt for the episode. You'll also have the option to add a link to the feedback comment box from your show notes. The prompt is displayed on the comment box for that episode.
Our feedback feature is also available with our Tip Jar to paid subscribers. If a listener pays to become a subscriber, you can allow them to reach out to you directly through their subscriber dashboard.
Try Pinecast
for free
Whether you’re just starting out or you’re more established, we have a solution for you.
No credit card required